
In May, the State Statistics Service noted a decrease in prices for clothing and footwear and an increase in prices for food products
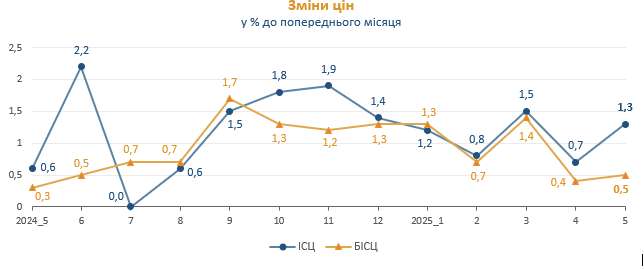
The State Statistics Service of Ukraine summed up the results of last month and recorded an increase in inflation from 15.1% to 15.9% in May 2025, year-on-year. In May, this indicator increased by 1.3%, and since the beginning of this year – by 5.6%. At the same time, the prices of food and non-alcoholic beverages jumped the most in year-on-year terms: for eggs – by 86%, vegetables – by 35.7%, sunflower and butter – by 35.4% and 28.5%, respectively. Also, prices for alcohol and tobacco products increased by 18.3%, for housing and communal services – by 20.1%, for communications – by 18.5%, for healthcare – by 13.1%. At the same time, clothing and footwear became cheaper by 1.9%, in particular, footwear – by 2.4%, clothing – by 1.5%. Transport prices also decreased by 0.1%, mainly due to a 1.3% decrease in fuel and lubricants and a 0.7% increase in rail passenger transport. Road passenger transport prices increased by 0.5%.
In general, according to the State Statistics Service, inflation in the consumer market in May 2025 compared to April 2025 was 1.3%, from the beginning of the year – 5.6 %. Core inflation in May 2025 compared to April 2025 was 0.5%, from the beginning of the year – 4.4 %.
Changes in consumer prices for goods and services (percentage)
| May 2025 to | January–May 2025 to | |||
| April
2025 |
December
2024 |
May
2024 |
January–May 2024 | |
| Consumer prices | 1.3 | 5,6 | 15.9 | 14.4 |
| Food and soft drinks | 2.8 | 9.0 | 22.1 | 17.7 |
| Food products | 2.9 | 9.0 | 22.2 | 17.7 |
| bread and bakery products | 0.7 | 5.1 | 18.8 | 17.8 |
| bread | 1.2 | 6.5 | 22.3 | 21.3 |
| pasta | 1.0 | 3.5 | 13.0 | 11.4 |
| meat and meat products | 5.4 | 12.5 | 18.2 | 10.3 |
| fish and fish products | 1.4 | 5.3 | 13.3 | 12.5 |
| milk | -0.7 | 2.0 | 20.9 | 19.3 |
| cheese and soft cheese | 0.6 | 4.4 | 18.0 | 17.7 |
| eggs | -8.7 | -15.8 | 86.0 | 32.5 |
| butter | -0.8 | 2.6 | 28.5 | 31.3 |
| sunflower oil | 0.4 | 9.0 | 35.4 | 32.4 |
| fruits | 17.6 | 39.1 | 33.5 | 20.9 |
| vegetables | 1.2 | 10.4 | 35.7 | 33.4 |
| sugar | 0.7 | 2.2 | 12.4 | 7.6 |
| Soft drinks | 1.8 | 8.6 | 19.7 | 17.1 |
| Alcoholic beverages, tobacco products | 1.4 | 7.7 | 18.3 | 16.3 |
| Clothing and shoes | -1.9 | 1.9 | -4.8 | -4.2 |
| Clothing | -1.5 | 1.2 | -4.7 | -4.4 |
| Footwear | -2.4 | 2.9 | -4.8 | -4.3 |
| The data do not include the territories temporarily occupied by the Russian Federation and parts of the territories where hostilities are (were) ongoing. The selection of cities is carried out at the state level and is representative for calculating the CPI for each region of the country. Monitoring of changes in consumer prices (tariffs) is not carried out in rural areas.
|